A small business rarely has a data shortage. The real problem is usually the opposite: marketing data is scattered across Google Ads, Meta Ads, Google Analytics 4, email platforms, call tracking tools, CRMs, spreadsheets, invoices, and sales notes. You may know how many clicks you received, how much you spent, or how many form submissions came in, but still not know whether your marketing is actually profitable.
That is where a marketing dashboard for small business becomes valuable. Not because it gives you more charts, but because it helps you make better decisions faster.
The best dashboard does not simply answer, “What happened?” It answers more useful questions: Which campaign should we scale? Which channel is wasting budget? Why did cost per lead increase? Are leads turning into sales? What should we fix this week?
A strong small business marketing dashboard turns reporting into direction. It gives owners, marketers, and sales teams one clear place to understand performance, spot problems, and decide what to do next.
What Is a Marketing Dashboard for Small Business?
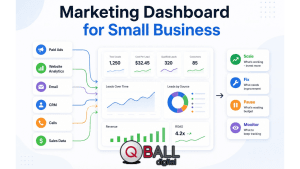
A marketing dashboard for small business is a centralized view of the marketing metrics that matter most, designed to help owners and teams monitor performance, understand ROI, and make faster decisions.
Unlike a traditional report, which often summarizes past performance over a fixed period, a dashboard is usually built for ongoing monitoring. It may update daily, weekly, or in near real time depending on the tools and data sources connected. This makes it more useful for active decision-making, especially when a business is running paid campaigns, testing landing pages, or managing leads across multiple channels.
For small businesses, the dashboard should be simple enough to use regularly. A dashboard with 50 charts may look impressive, but it often creates more confusion than clarity. The goal is not to display every available metric. The goal is to show the numbers that explain whether marketing is helping the business grow.
A good dashboard connects marketing activity to business outcomes. That means it should not stop at impressions, clicks, or traffic. It should help you understand how those activities affect leads, qualified opportunities, booked calls, sales, revenue, customer acquisition cost, and return on ad spend.
Google Analytics 4, for example, provides acquisition reports that help businesses understand where users are coming from, including both new and returning users. That type of source-level visibility is useful, but it becomes much more powerful when combined with paid media, CRM, and sales data in one dashboard.
Why Does a Small Business Need a Marketing Dashboard?
A small business needs a marketing dashboard because fragmented data makes it hard to see what is working, what is wasting budget, and where to focus next.
Without a dashboard, many businesses make marketing decisions based on isolated numbers. One platform may show that clicks are increasing. Another may show that leads are coming in. A CRM may show that few of those leads became customers. Separately, each number tells part of the story. Together, they reveal whether the business is actually growing profitably.
This matters because small businesses usually have tighter budgets and smaller teams. There is less room to spend weeks interpreting performance or months funding underperforming campaigns. When budget is limited, every marketing dollar needs a job.
A marketing dashboard helps reduce guesswork. Instead of asking, “Do we feel like this campaign is working?” the team can ask, “Is this campaign generating qualified leads at or below our target cost?” That shift makes reporting more objective and less emotional.
A dashboard also improves alignment between marketing and sales. Marketing may celebrate low-cost leads, while sales may complain that those leads are poor quality. A useful dashboard brings those conversations together by showing not only lead volume and cost per lead, but also appointment rate, close rate, revenue by source, and customer quality.
For example, a local service business may see a strong number of Google Ads form submissions but very few booked jobs. That does not necessarily mean the ads failed. It may mean the landing page attracted the wrong intent, the form allowed unqualified leads, or the sales team followed up too slowly. The dashboard should help the business find that next question.
An ecommerce business may see high traffic from social ads but weak revenue. In that case, the dashboard should show whether the problem is low add-to-cart rate, poor checkout completion, weak offer fit, or traffic from the wrong audience.
For a B2B company, the dashboard may reveal that one channel produces expensive leads but high-value customers, while another produces cheap leads that rarely close. Without sales and revenue context, the cheaper channel may look better than it really is.
What Should a Small Business Marketing Dashboard Tell You?
A small business marketing dashboard should tell you what happened, why it matters, and what action to take next.
The most useful dashboards include a decision layer. This means the dashboard does not only show numbers; it helps categorize performance into practical actions. Every important metric should help the team decide whether to keep doing something, fix something, stop something, or scale something.
What should you keep doing?
Your dashboard should show which marketing activities are already working. These are campaigns, channels, offers, or landing pages that are producing results close to or better than your goals.
For example, if a campaign has a strong conversion rate, stable cost per lead, and strong lead-to-sale rate, the dashboard should make that clear. The business may not need to change that campaign immediately. Instead, the right action may be to protect it, monitor it, and use its patterns to improve weaker campaigns.
Strong signals may include rising return on ad spend, declining cost per lead, improving conversion rate, higher-value customers from a specific source, or consistent lead quality from a particular keyword group.
What should you fix?
A good dashboard should also point to friction. These are places where performance is not failing completely, but something is limiting results.
For example, high website traffic with a low conversion rate may point to landing page issues. Strong lead volume with a low appointment rate may point to poor lead quality or slow sales follow-up. Rising cost per click with flat lead volume may indicate stronger competition, weaker ad relevance, or a need to refine keyword targeting.
The dashboard should not force users to dig through five platforms to find these patterns. It should put related metrics close together so the problem becomes easier to diagnose.
What should you stop or pause?
Some marketing activity drains budget without producing meaningful business value. A decision-focused dashboard helps identify those areas early.
This might include campaigns with spend but no conversions, keywords with high cost and low intent, channels producing poor-fit leads, or ads that generate clicks without qualified inquiries. In PPC, this is especially important because wasted spend can accumulate quickly.
Google Ads conversion tracking allows advertisers to understand how ads lead to valuable customer actions, and reporting columns can be customized to show the conversion information that matters to the business. For a small business dashboard, this means conversions should be configured around meaningful actions, not just easy-to-measure interactions.
What should you scale?
The dashboard should also reveal opportunity. Not every strong campaign is ready to scale, but a campaign with good lead quality, profitable acquisition cost, and room in the budget deserves attention.
Scaling signals may include campaigns under budget but above target return, landing pages with high conversion rates, audiences with low acquisition cost and strong customer quality, or channels generating consistent revenue.
The key is to scale based on business value, not surface-level activity. More clicks do not automatically mean more growth. More qualified customers at a profitable cost does.
How Do You Choose the Right KPIs for a Marketing Dashboard?
Choose KPIs based on the decisions the dashboard needs to support, not based on every metric available.
This is one of the most important principles in dashboard design. Small businesses often make the mistake of starting with tools instead of questions. They connect Google Ads, GA4, Meta Ads, and a CRM, then add every chart that looks interesting. The result is a dashboard that shows a lot but explains very little.
A better approach is to start with the decision. Are you trying to decide where to spend more budget? Which campaigns to pause? Whether marketing is generating profitable customers? Whether sales is following up effectively? Each decision requires different KPIs.
Business outcome KPIs
Business outcome KPIs sit at the top of the dashboard because they show whether marketing is supporting growth.
These may include total revenue, marketing-sourced revenue, pipeline value, customer acquisition cost, customer lifetime value, return on ad spend, marketing ROI, and revenue by channel. These metrics help owners understand whether marketing is producing value beyond activity.
For small businesses, even a simple version of this is useful. You may not have perfect attribution or full lifetime value modeling at first. But connecting lead source, closed sales, and revenue is already a major improvement over looking only at clicks and leads.
Lead generation KPIs
Lead generation KPIs show whether marketing is creating enough demand and whether that demand is worth pursuing.
Useful metrics include total leads, cost per lead, landing page conversion rate, marketing-qualified leads, sales-qualified leads, lead-to-sale rate, booked calls, form submissions, and phone calls. For service businesses, these metrics are often more useful than ecommerce-style revenue metrics because the sale may happen offline or after a consultation.
However, lead volume should never be reviewed alone. A campaign that generates 100 low-quality leads may be worse than a campaign that generates 20 high-intent prospects. Your dashboard should help distinguish between activity and opportunity.
Paid media KPIs
Paid media KPIs are essential when a business is investing in PPC campaigns.
Important metrics include spend, impressions, clicks, click-through rate, cost per click, conversions, cost per acquisition, conversion value, and return on ad spend. These metrics help show how efficiently advertising budget is being turned into results.
Google’s Target CPA bidding, for example, is designed to help advertisers get as many conversions or customer actions as possible at a desired average cost per conversion. That makes CPA an important dashboard metric when paid campaigns are optimized around lead or action volume.
For ecommerce or revenue-tracked campaigns, return on ad spend becomes especially important. Google’s Target ROAS bidding uses conversion value predictions to help maximize return, which reinforces why tracking conversion value properly matters when revenue is part of the campaign goal.
Website and landing page KPIs
Website KPIs explain what happens after people arrive on your site.
Useful metrics include sessions, users, engagement rate, landing page conversion rate, form completion rate, top landing pages, traffic source performance, and conversion events. These metrics help diagnose whether the issue is traffic quality, page experience, offer strength, or user intent.
GA4 traffic acquisition reporting is especially useful here because it helps show where website and app users are coming from. That gives small businesses a starting point for comparing performance by source, medium, and campaign.
Sales follow-up KPIs
Sales follow-up KPIs are often missing from marketing dashboards, but they are critical for small businesses.
These may include new leads contacted, average speed to lead, appointment booking rate, show rate, close rate, revenue by source, and lost lead reasons. These metrics help reveal whether marketing is attracting the wrong people or whether good leads are being lost after the inquiry.
A PPC campaign may look weak if you only check revenue, but the real issue may be that leads are not being contacted quickly. Likewise, a campaign may look efficient based on low cost per lead but fail once sales quality is reviewed.
How Do You Build a Marketing Dashboard for Small Business Step by Step?
Build the dashboard by starting with business goals, selecting decision-focused KPIs, connecting data sources, organizing the layout, and reviewing it regularly.
The dashboard does not need to be perfect on day one. In fact, the best first version is usually simple. It should answer the most important questions clearly, then improve over time as tracking, attribution, and sales data become more reliable.
Step 1: Define the business decision the dashboard should support
Start by writing down the decisions your dashboard needs to help you make.
For example, a PPC-focused dashboard may need to answer: Should we increase or reduce ad spend? Which campaign is producing the best leads? Which keywords are wasting money? Which landing page needs improvement? Are we generating customers at a profitable cost?
A broader marketing dashboard may need to answer: Which channels generate the most revenue? Are organic, paid, email, and referral sources moving in the right direction? Is marketing creating enough qualified demand for sales? Are we overinvesting in channels that do not convert?
This step prevents dashboard overload. If a metric does not support a decision, it probably does not need to be on the main dashboard.
Step 2: Choose only the KPIs tied to that decision
Once the decisions are clear, choose a focused set of KPIs. For many small businesses, 8–12 core metrics are enough for the main dashboard.
A strong first version may include total spend, leads, cost per lead, conversion rate, qualified leads, booked appointments, closed sales, revenue, return on ad spend, and top-performing channels. Diagnostic metrics can live lower on the dashboard or in separate tabs.
The goal is to make the dashboard easy to review in a few minutes. If the owner or marketing manager needs 45 minutes just to understand the dashboard, it is too complicated.
Step 3: Connect your data sources
Next, connect the platforms where your marketing and sales data live.
Common data sources include Google Ads, Meta Ads, Google Analytics 4, Google Search Console, CRM software, call tracking tools, email marketing platforms, ecommerce platforms, spreadsheets, and accounting data.
Looker Studio is a common option for small businesses because it can connect data sources and turn them into visual reports and dashboards. Google’s documentation describes Looker Studio connectors as a way to add data sources for analysis and reporting.
The most important point is not the tool itself. It is whether the data is accurate, connected, and useful. A beautiful dashboard with broken conversion tracking will lead to bad decisions.
Step 4: Organize the dashboard by priority
A practical dashboard should move from high-level outcomes to detailed diagnostics.
The top row should show business results: revenue, leads, cost per lead, conversion rate, spend, and return. The middle section should show channel performance: Google Ads, organic search, paid social, email, referral, and direct traffic. The lower section should show diagnostics: campaign performance, landing page performance, keyword or audience performance, and sales follow-up metrics.
This layout mirrors how decisions are usually made. First, you ask whether the business is on track. Then you ask which channel or campaign caused the change. Then you investigate the reason.
Step 5: Add targets, benchmarks, and thresholds
A number alone is not enough. The dashboard should show whether performance is good, bad, improving, or declining.
For example, “CPA: $92” is less useful than:
Target CPA: $75
Current CPA: $92
Status: Above target
Action: Review search terms, ad relevance, and landing page conversion rate
Targets create context. Without them, every metric requires interpretation from scratch. With them, the dashboard can immediately show which areas are on track and which need attention.
Step 6: Schedule a weekly dashboard review
A dashboard only creates value when it becomes part of decision-making.
For most small businesses, a weekly dashboard review is a good starting point. Use that meeting to answer a few practical questions: What changed? Why did it change? What needs action? Who owns the next step? What should we review again next week?
This rhythm turns the dashboard from a passive reporting asset into an active management tool.
What Should the Layout of a Small Business Marketing Dashboard Look Like?
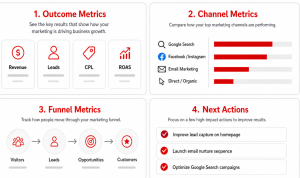
The layout should move from high-level business outcomes to channel-level performance, then to diagnostic details that explain why performance changed.
A dashboard should be designed around how people think, not how platforms export data. Most owners do not want to start with impressions by campaign. They want to know whether marketing is producing leads, sales, and revenue at an acceptable cost. The layout should respect that priority.
Executive summary panel
The executive summary panel should sit at the top of the dashboard. This is the fast-read section for owners and decision-makers.
It may include revenue, marketing-sourced revenue, total leads, qualified leads, cost per lead, cost per acquisition, total ad spend, conversion rate, return on ad spend, and month-over-month change.
This panel should answer: Are we on track?
Use clear visual indicators. Green, yellow, and red status labels can help, but they should be tied to real thresholds. For example, green may mean CPA is at or below target, yellow may mean CPA is within 10–15% of target, and red may mean CPA is significantly above target.
Channel performance panel
The channel panel should compare performance across marketing sources.
For a small business, this might include Google Ads, Meta Ads, organic search, local search, email, referrals, direct traffic, and paid directories. Each channel should be compared using metrics that matter to the business, such as leads, qualified leads, cost, conversion rate, revenue, and return.
This section helps answer: Where are results coming from?
It also helps prevent overreliance on one metric. One channel may drive the most traffic, while another drives fewer but better leads. A good dashboard makes that distinction easy to see.
Funnel performance panel
The funnel panel shows how prospects move from first visit to final sale.
A simple funnel may include visitors, leads, qualified leads, appointments, proposals, sales, and revenue. For ecommerce, the funnel may include sessions, product views, add-to-cart actions, checkout starts, purchases, and revenue.
This section helps answer: Where are people dropping off?
If traffic is strong but leads are weak, the issue may be landing page conversion. If leads are strong but sales are weak, the issue may be lead quality, offer fit, pricing, or follow-up. If sales are strong but revenue is low, the business may need to review average order value or customer quality.
Campaign action panel
The campaign action panel is what makes the dashboard especially useful.
Instead of only showing campaign performance, this section should group campaigns by recommended action:
- Campaigns to scale
- Campaigns to monitor
- Campaigns to fix
- Campaigns to pause
This section can include notes such as “High spend, low conversion rate,” “Strong lead quality, limited budget,” or “CPA above target for two consecutive weeks.” These notes help the dashboard move from reporting to action.
Which Dashboard Tools Are Best for Small Businesses?
The best dashboard tool depends on budget, data complexity, technical skill, and how much automation the business needs.
There is no single best tool for every small business. A company running one ad channel and tracking leads manually may not need the same setup as a multi-location service business with Google Ads, Meta Ads, call tracking, CRM stages, and offline sales.
The right tool is the one your team can actually maintain and use.
Spreadsheets
Spreadsheets are often the easiest starting point. They are inexpensive, flexible, and familiar. A small business can use Google Sheets or Excel to track spend, leads, cost per lead, close rate, and revenue by source.
The limitation is manual work. Spreadsheets become harder to maintain as campaigns grow, data sources multiply, and stakeholders expect more frequent updates. Manual entry also increases the risk of errors.
A spreadsheet can work well for an early dashboard, but it should not become a long-term bottleneck.
Looker Studio
Looker Studio is often a strong option for small businesses that use Google Ads, GA4, and Google Search Console.
It allows businesses to build visual reports and connect data sources, making it useful for dashboards that need to update more consistently than a spreadsheet. It is especially practical for Google ecosystem reporting.
However, businesses should still be careful with setup. Data connectors, blended data, filters, and permissions need to be configured correctly. Access should also be reviewed regularly, especially when dashboards include sensitive sales or customer information.
Power BI or Tableau
Power BI and Tableau are better suited for businesses with more complex reporting needs. They are useful when data must be pulled from multiple databases, CRMs, financial systems, or custom sources.
These tools can be powerful, but they may require more technical setup. For many small businesses, they are most useful when there is a dedicated analyst, operations lead, or agency partner involved.
CRM or marketing platform dashboards
Some businesses can build useful dashboards directly inside their CRM or marketing platform.
This works well when most customer journey data already lives in one system. For example, a CRM dashboard can show leads, deals, pipeline value, close rate, and revenue by source. That can be extremely valuable for service businesses and B2B companies.
The weakness is that platform-native dashboards may not show the full marketing picture unless ad spend, website behavior, and campaign data are also connected.
Custom dashboard built by a digital marketing partner
A custom dashboard is often the best option when the business needs reliable PPC visibility, lead quality reporting, and action-oriented recommendations.
This is especially useful when the dashboard needs to combine ad performance, GA4 data, call tracking, CRM stages, and sales outcomes. A custom approach can also include decision rules, annotations, and recommendations that are specific to the business.
The tradeoff is cost and setup time, but the benefit is clarity. A well-built custom dashboard can save time, reduce wasted spend, and improve confidence in marketing decisions.
How Do You Make a Marketing Dashboard Actionable?
Make a marketing dashboard actionable by pairing every important metric with context, thresholds, and a clear next step.
This is where many dashboards fail. They show data, but they do not tell the user what to do with it. A chart that shows cost per lead increased is helpful. A dashboard that also shows the target CPL, the affected campaign, the likely cause, and the recommended action is much more useful.
HubSpot describes KPI dashboards as a central place for important metrics tied to goals, growth, and impact. That goal-oriented approach is important because dashboards should not simply collect numbers; they should help people understand progress toward meaningful outcomes.
Add goals beside every KPI
Every major KPI should have a goal or benchmark beside it.
For example:
- Cost per lead target: $60
- Current cost per lead: $74
- Qualified lead target: 40 per month
- Current qualified leads: 31
- Landing page conversion target: 8%
- Current conversion rate: 5.6%
Goals turn data into judgment. They allow the dashboard to show whether performance is acceptable without relying on memory or guesswork.
Use status labels
Status labels make dashboards easier to scan.
Simple labels such as “On Track,” “Needs Attention,” “Under Target,” and “Scaling Opportunity” help users quickly prioritize. This is especially useful for small business owners who do not live inside analytics tools every day.
The labels should be based on clear rules. For example, a campaign may be marked “Needs Attention” if CPA is 20% above target for two weeks, or “Scaling Opportunity” if CPA is below target and lead quality is above average.
Group metrics by decision
Many dashboards group data only by platform. That can be useful, but it is not always the best way to drive action.
Try grouping metrics by decision type:
- Budget decisions
- Lead quality decisions
- Conversion decisions
- Sales follow-up decisions
- Channel mix decisions
For example, budget decisions may include spend, CPA, ROAS, conversion volume, and lead quality by campaign. Lead quality decisions may include MQL rate, SQL rate, close rate, and revenue by source. This structure helps the user move from data to action faster.
Include diagnostic questions
A dashboard should help users ask better questions.
- If CPA increased, did cost per click rise, or did conversion rate fall?
- If lead volume increased, did lead quality decline?
- If revenue dropped, did traffic decline, conversion rate decline, or close rate decline?
- If ROAS improved, was it because revenue increased or because spend decreased?
These questions can be built into dashboard notes, review templates, or recurring meeting agendas. They help prevent shallow analysis.
Assign next actions
The final step is adding action.
Examples of dashboard-driven actions include pausing low-intent keywords, reallocating budget to the highest-performing campaign, rewriting a landing page headline, improving speed to lead, testing a stronger offer, excluding poor-fit audiences, or reviewing sales objections from recent leads.
The dashboard should make ownership clear. A next action without an owner often becomes another ignored insight.
What Mistakes Should Small Businesses Avoid When Building a Marketing Dashboard?
The biggest mistake is building a dashboard that looks impressive but does not help anyone make better decisions.
Small businesses do not need enterprise-level reporting complexity to improve marketing performance. They need clarity, accuracy, and consistent action. Avoiding a few common mistakes can make the dashboard much more useful.
Tracking too many metrics
Too many metrics create noise. When every chart appears important, nothing feels urgent.
Start with the metrics that directly support decisions. You can always add diagnostic views later. The main dashboard should stay focused on the questions leadership and marketing need to answer regularly.
Focusing on vanity metrics
Impressions, likes, reach, and traffic can be useful, but only when they explain business outcomes.
A campaign with high reach but no qualified leads is not necessarily successful. A blog post with strong traffic but no conversions may need a better call to action. A social campaign with many likes may still fail to generate revenue.
Vanity metrics become useful only when connected to a deeper question: Did this activity help us attract, convert, or retain better customers?
Ignoring lead quality
Lead quality is one of the most important dashboard gaps for small businesses.
A campaign with a low CPL may appear successful until sales data shows that the leads rarely answer, cannot afford the service, or are looking for something the business does not offer. That is why dashboards should include downstream metrics such as qualified leads, appointments, close rate, and revenue by source.
Separating marketing from sales data
Marketing and sales data should not live in separate worlds.
If the dashboard stops at form submissions, the business cannot see whether those forms turned into customers. If sales data is not connected, marketing may optimize for the cheapest lead instead of the most profitable customer.
Even a simple CRM connection or manual closed-sale import can dramatically improve dashboard usefulness.
Reviewing the dashboard without making decisions
A dashboard review should not be a passive meeting.
Each review should end with decisions: What are we scaling? What are we fixing? What are we pausing? What are we testing? What needs more data?
If no action comes from the dashboard, either the dashboard is not designed well or the review process needs improvement.
Letting tracking break
Tracking requires maintenance. UTMs, conversion actions, CRM fields, call tracking numbers, thank-you pages, forms, and analytics events can break or drift over time.
This is especially important in PPC. If conversion tracking is wrong, bidding, budget allocation, and performance analysis can all be affected. Google Ads reporting depends on properly configured conversion actions and reporting columns, so businesses need to make sure the dashboard is pulling from meaningful, accurate conversion data.
How Often Should You Review Your Marketing Dashboard?
Most small businesses should review core dashboard metrics weekly, campaign performance more frequently, and strategic ROI trends monthly.
The right cadence depends on campaign volume, budget, and how quickly decisions need to be made. A business spending heavily on PPC may need to check performance several times per week. A business focused on SEO and email may not need daily review.
The key is matching the review rhythm to the speed of the channel.
Daily or every few days
For active PPC campaigns, review high-risk metrics frequently.
These may include spend, conversions, cost per conversion, disapproved ads, sudden traffic drops, campaign pacing, and major tracking issues. Daily review does not mean making big changes every day. It means catching obvious problems before they waste budget.
Google Ads automated bidding strategies such as Target CPA and Target ROAS use conversion and value signals to optimize bidding, so sudden tracking problems or poor conversion data can affect campaign decisions.
Weekly
Weekly reviews are best for operational decisions.
Review leads, cost per lead, conversion rate, campaign performance, landing page performance, sales follow-up, and lead quality. This is the ideal cadence for deciding what to adjust in campaigns, content, offers, or sales handling.
A weekly review should be structured and action-focused. Look at what changed, identify the likely cause, decide the next step, and assign ownership.
Monthly
Monthly reviews are better for strategic decisions.
This is where you review return on ad spend, customer acquisition cost, revenue by channel, marketing-sourced pipeline, budget allocation, lead quality trends, and overall marketing contribution.
Monthly trends are more reliable than daily fluctuations. They help you decide whether to shift budget, change offers, invest in new channels, or refine your customer acquisition strategy.
Quarterly
Quarterly reviews should focus on bigger planning questions.
This may include channel mix, campaign strategy, customer acquisition economics, sales and marketing alignment, tracking improvements, and dashboard upgrades. It is also a good time to remove unused metrics and add new ones based on business priorities.
A dashboard should evolve with the business. What mattered when the company was focused on lead volume may change when the company shifts toward profitability, retention, or higher-value customers.
Can a Marketing Dashboard Help Improve PPC Performance?
Yes. A marketing dashboard can improve PPC performance by showing which campaigns, keywords, audiences, and landing pages are producing profitable leads or sales.
PPC is one of the strongest use cases for a small business marketing dashboard because paid campaigns generate data quickly and budget decisions have immediate consequences. When performance changes, the business needs to know whether the issue is spend, targeting, conversion rate, lead quality, or sales follow-up.
A PPC dashboard should go beyond clicks and CPC. Clicks can show interest, and CPC can show media efficiency, but neither proves that the campaign is profitable. The dashboard should connect ad spend to conversions, qualified leads, appointments, closed deals, revenue, and return.
For lead generation businesses, the dashboard should show whether paid campaigns are generating the right types of leads. For ecommerce businesses, it should show conversion value and return on ad spend. Google Ads supports conversion value reporting, and conversion data can be used to understand how ads lead to valuable customer actions.
A useful PPC dashboard also helps with budget pacing. If a campaign is spending too quickly without conversions, the team can investigate early. If a campaign is under budget but performing well, the team may have an opportunity to increase investment.
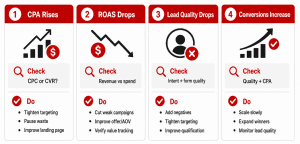
The most valuable PPC dashboards translate metrics into action rules.
- If CPC rises but conversion rate holds steady, review competition, bids, match types, and keyword quality.
- If leads increase but close rate drops, review keyword intent, audience targeting, form questions, and sales feedback.
- If CPA is below target and lead quality is strong, consider increasing budget gradually.
- If spend is high and conversions are flat, review search terms, landing page relevance, and conversion tracking.
- If ROAS drops, check whether average order value, conversion rate, or traffic quality changed.
FAQ
What is the most important KPI in a marketing dashboard for small business?
The most important KPI depends on the business model, but most small businesses should prioritize revenue, qualified leads, cost per lead, conversion rate, customer acquisition cost, and return on ad spend.
For lead generation businesses, qualified leads and cost per qualified lead may matter more than raw lead volume. For ecommerce businesses, revenue, conversion value, and ROAS may be more important. The best KPI is the one that most clearly connects marketing activity to business growth.
How many KPIs should a small business marketing dashboard have?
A practical small business dashboard should usually start with 8–12 core KPIs.
That is enough to show performance without overwhelming the user. Additional diagnostic metrics can be added in secondary sections or separate tabs. The main dashboard should stay focused on decisions, not data collection.
What is the difference between a marketing dashboard and a marketing report?
A marketing dashboard is an ongoing performance view used for monitoring and decision-making. A marketing report is usually a static summary of what happened during a specific period.
Dashboards are better for regular optimization because they can show current trends, campaign health, and areas needing attention. Reports are useful for explaining performance, documenting results, and sharing deeper analysis with stakeholders.
Can I build a marketing dashboard in Google Sheets?
Yes. Google Sheets can work well for a simple first version of a small business marketing dashboard.
It is especially useful when the business has a limited budget or only a few data sources. However, as reporting needs grow, manual updates can become time-consuming and error-prone. At that point, a more automated dashboard tool may be a better option.
What is the best free dashboard tool for small businesses?
Looker Studio is often a strong free or low-cost option for small businesses, especially those using Google Ads, GA4, and Google Search Console.
It allows businesses to create visual dashboards and connect data sources. However, the quality of the dashboard still depends on accurate tracking, clean data, and thoughtful KPI selection.
Should a small business marketing dashboard include sales data?
Yes. A small business marketing dashboard should include sales data whenever possible.
Without sales data, the dashboard may show how many leads were generated but not whether those leads became customers. Sales data helps reveal lead quality, close rate, revenue by source, and true marketing ROI.
Conclusion
A strong marketing dashboard for small business should not simply display more data. It should help the business understand what is working, what is underperforming, where budget is being wasted, and what action should happen next.
The best dashboards are simple, focused, and connected to business outcomes. They show the metrics that matter, organize them around decisions, and make it easier to identify whether the next move is to scale, fix, pause, or investigate.
For small businesses, the goal is not perfect analytics complexity. The goal is better marketing judgment. When your dashboard connects spend, leads, sales, and revenue in one clear view, you can stop guessing and start making decisions with confidence.
Why QBall Digital is Your Ideal Choice for Marketing Dashboards?
QBall Digital helps small businesses turn scattered marketing data into clear, decision-ready dashboards. Instead of overwhelming you with every possible metric, QBall Digital focuses on the numbers that actually affect leads, sales, revenue, and advertising performance. This makes your reporting easier to understand and more useful for day-to-day decisions.
With deep PPC and digital marketing expertise, QBall Digital understands that dashboards need to do more than look professional. They need to reveal where budget is working, where leads are coming from, and which campaigns deserve attention. By connecting reporting with strategy, QBall Digital helps small businesses move from guessing to confident optimization.
QBall Digital can also help you build the tracking foundation behind the dashboard. That includes campaign tracking, conversion measurement, source reporting, lead quality visibility, and PPC performance analysis. When the data is organized correctly, your dashboard becomes more than a reporting tool; it becomes a practical system for smarter growth.
Build a Smarter Marketing Dashboard with QBall Digital
Your marketing dashboard should show you more than what happened. It should show you what to do next.
Partner with QBall Digital to build a clear, practical reporting system that helps you track performance, reduce wasted spend, and make better marketing decisions.